This project aims to develop advanced framework, tools and software to extract and manage big data of specific gene variants and a wide variety of neuroimaging phenotypes and to implement sophisticated statistical analysis and result visualization for neuroimaging PheWAS on big data. The methods and tools will be applied to conduct broad surveys on extensive neuroimaging genomic data for discovery of system-level true associations of SNPs of interest with the brain.
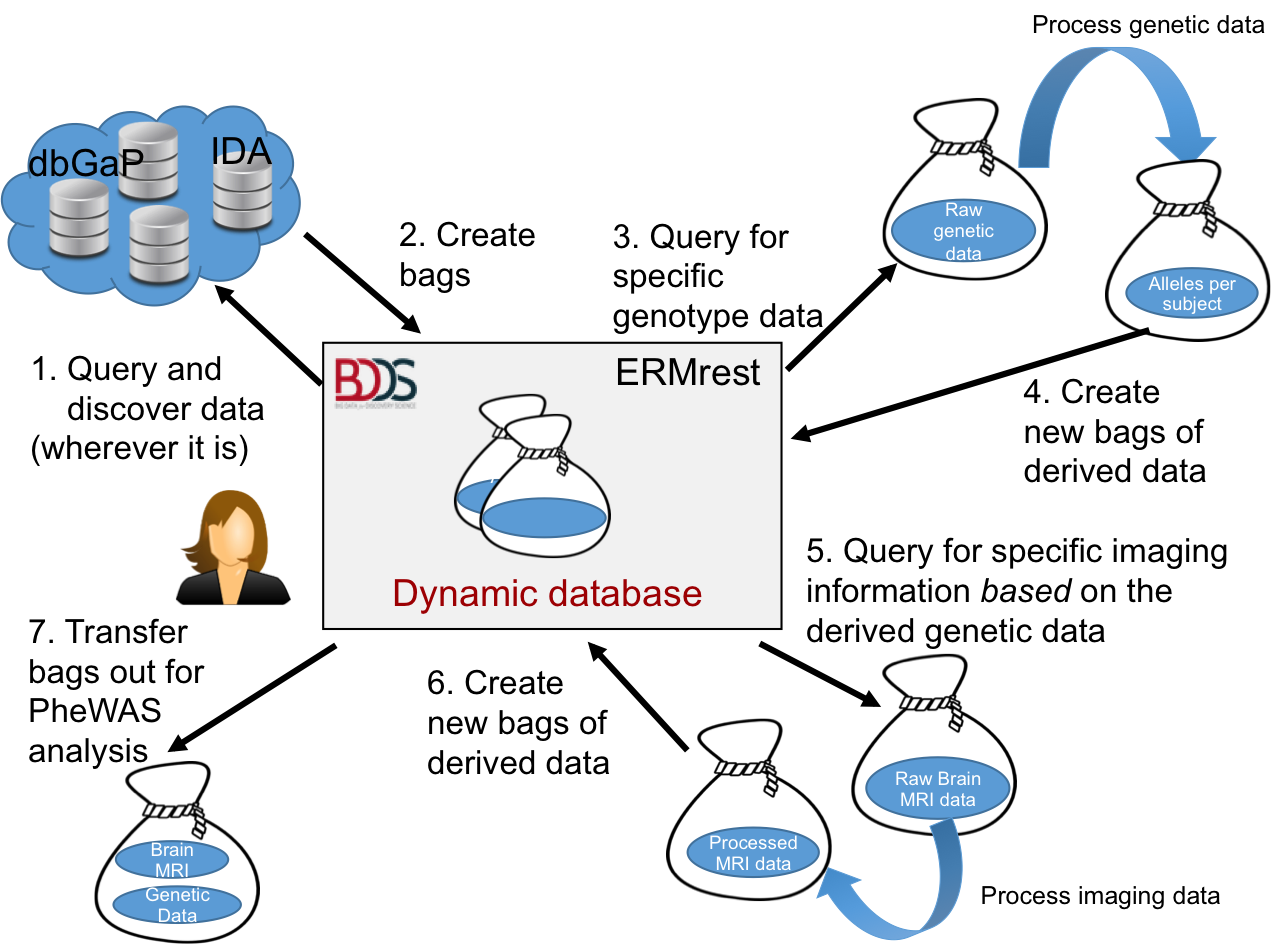
First, raw phenotype, genetic, and neuroimaging data are loaded into the DERIVA data catalog using an "Extract, Transform, Load" process. This process involves the ingest of data (the “Extracts”) from one or more tabular data files in CSV format representing phenotypic data for an entire study cohort, one or more tabular files of genetic variant data in the VCF format, and MRI neuroimaging files in various formats such as DICOM, NIFTI, MGZ, etc. During this process, various software utilities are used to perform the “Transforms” required to prepare the data for loading into the catalog. Specifically:
After the transform process is complete, the transformed data is “Loaded” into the Deriva catalog, and then annotated. The annotation step is a Deriva-specific process which facilitates further customization and fine-tuning of how data is presented to the user in the Deriva web-based user interface.
Once the base data has been loaded, the Deriva web-based user interface can be used to query the catalog for subjects with data on the genotype of interest. Neuroimaging data for subjects matching the search criteria are extracted into BDBag formatted archive files. Next, the neuroimaging data is processed through comprehensive volumetric and surface-based analysis (FreeSurfer) on the LONI pipeline. This produces derived digital image processing outputs (generally in MGZ format) and volumetric measurements in tabular form that are loaded back into the data catalog in the same manner as the initial data load, i.e., via the same ETL processing.
Finally, target genotype and phenotype data is extracted and output from Deriva in BDBag format. The BDBag includes the following:
The contents of the BDBag can now be loaded into the NeuroimagingPheWAS Toolbox for phenome-wide association study to make genotype-to-phenotype associations.